News & Trends
Empa is making greenhouse gases visible from space
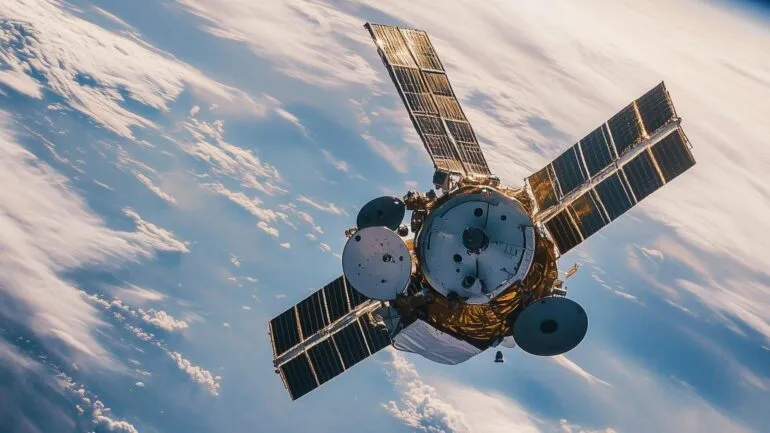
New satellites are making it possible to identify, almost in real time, where greenhouse gases are being emitted into the atmosphere. This is thanks to global maps developed by Empa in collaboration with international partners. We spoke with Empa researcher Gerrit Kuhlmann about the new opportunities from space.

Gerrit Kuhlmann
Empa is supporting the European Space Agency (ESA) in developing the new earth observation satellites for the European Copernicus programme. Gerrit Kuhlmann has been a researcher with Empa for ten years, monitoring air quality and greenhouse gas emissions. He is advising the ESA on the development of the Copernicus satellite mission.
Gerrit Kuhlmann, your field of research is satellite-based Earth observation. What is your connection to space?
Satellites can measure the entire Earth’s surface within just a few days. Using this data, we create high-quality maps showing where greenhouse gases like CO₂, methane, and nitrogen oxides are being emitted. The images from space give us a new perspective on Earth — which I find fascinating. Viewing the planet from above offers an overview. Instead of political borders, our maps show the big picture, constantly reminding me how interconnected everything is on our planet.
Switzerland is not part of the European Copernicus program, yet Empa is allowed to contribute. How does climate protection from space work?
Earth observation satellites collect data around the clock. We can observe, for example, where forests are disappearing, where greening occurs, and where ice is melting. Over the years, this builds a vast body of knowledge about climate change. The new satellites will also be capable of measuring atmospheric greenhouse gases. It’s similar to how the first weather satellites drastically improved weather forecasting — these new satellites will provide more detailed data on who is emitting how much CO₂ and methane, when and where.
Why is it so important to know where and how much greenhouse gas is being emitted?
Our maps can show, almost in real time, where greenhouse gases are being released. This supports the mandatory reporting for countries that have signed the Paris Agreement. Until now, such values have been estimated using complex statistics, like the number of coal power plants or cars in a country. Not every country has the resources for this. Plus, there are questions about the accuracy, timeliness, and comparability of those estimates.
These maps will be available to governments worldwide. How do they help protect the climate?
Because the data is up-to-date, it enables swift action to reduce emissions. It also allows countries to identify major emission sources. For instance, we can see how much a specific coal power plant emits — and whether the numbers align with company reports. If there’s a major discrepancy between reported and actual emissions, our maps will soon make that clearly visible.
Can you give an example?
We can detect when an oil company releases methane into the atmosphere instead of flaring it. We can see leaks — and whether or not they are actually fixed. We can also monitor the effectiveness of climate measures. For example, emissions of CFC-11 have been banned for years, but researchers using ground-based data still detected emissions in eastern China. This was traced to specific industries, and Chinese authorities were notified. Two years later, follow-up measurements showed that measures had been taken to stop the emissions. That was with ground stations — satellites will soon provide this data globally.
What makes the new satellites so special?
The European Copernicus program is developing a constellation of three satellites for precise global monitoring of CO₂ and methane. Within just three and a half days, they will cover the entire planet, with a resolution of two kilometers. The first two satellites are expected to begin delivering data in 2027. The EU will make this information available to countries to help them implement targeted emission reduction strategies.
How useful will this data be?
Extremely useful. Initially, we’ll be able to measure emissions from countries, large cities, coal power plants, and industries. Early projects are already underway to enhance the maps with AI, so that in the future, we can zoom in even closer. The goal is to pinpoint emissions at the level of individual regions or cantons — where local political decisions are made. Our maps will also help improve understanding of consumption-based emissions.
What do you mean by that?
The majority of Switzerland’s CO₂ emissions are not produced domestically. Our carbon footprint comes mainly from CO₂-intensive products we consume. In the future, it may be possible to track the carbon footprint of individual products — across the entire supply chain. Take a smartphone: rare metals from Africa, chips from Taiwan, assembly in China, then shipped to Europe. That all adds up to a significant carbon footprint. Consumers should be able to make informed choices, which in turn motivates companies to lower their emissions.
What opportunities do climate-sensitive space technologies offer tech companies and start-ups?
The potential is huge. Tracking product-level carbon footprints is just one example. The Copernicus program provides raw satellite data free of charge specifically to foster innovation. Companies and start-ups can use this to create products and services that wouldn’t be possible otherwise. These tools can help countries progress. Swiss companies can use the data, but participation in the system’s development is limited, as Switzerland is not a member of the program due to cost-related decisions.
Discover the entire issue
Read more articles from our current issue: ‘10 opportunities
transforming our world’.
Be part of the solution and stay informed with the Futuremover.
Subscribe now and shape the future!
Magazin abonnieren EN
"*" indicates required fields